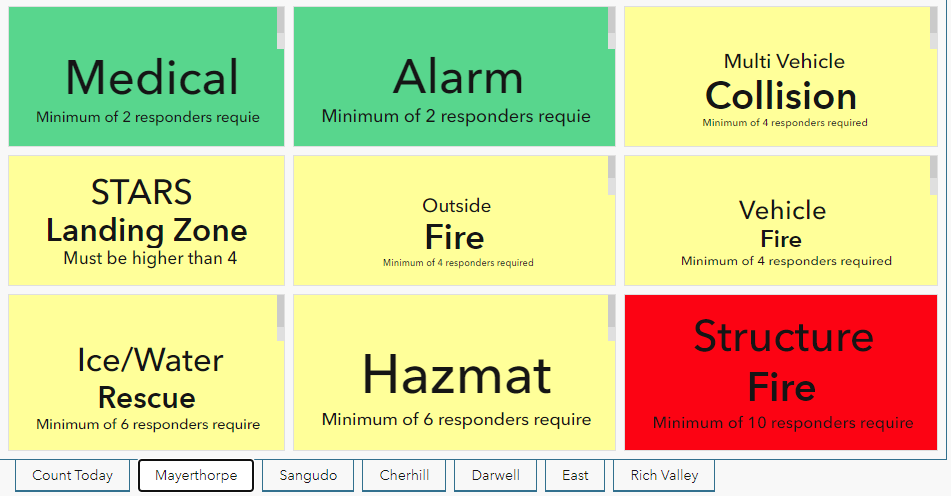
The above dashboard is used to show the status of each firehall when it comes to showing what type of emergency they are able to respond to with the available resources.
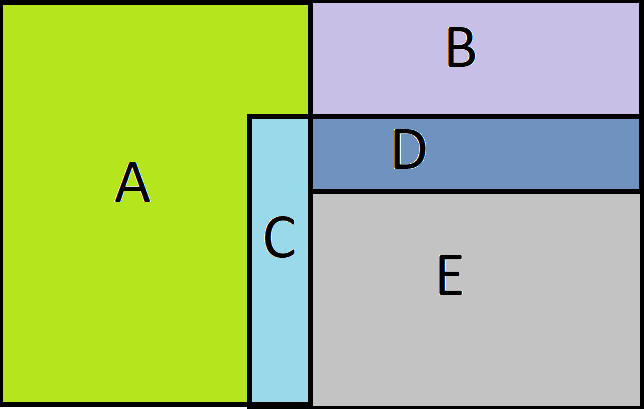
The image below shows how each firehall is able to respond. Responders can only assist in emergencies that border their own area. So below A can get help from B and C, B can get assistance from A and D, but C can get help from A, D and E.
The following arcade script was used in creation of each incident (STARS, Ice, etc). A filter was then applied to each firehall name to segment each calculation. This was done for all firehalls and then combined using the insert URL function within a new dashboard.
var howdy = $datapoint[“sum_Available”]
var backcolor2 = When(
howdy < 3,’#58d68d’, howdy >= 3,’#ffff66′,
‘#f7dc6f’);
var howdy = $datapoint[“Available”]
var backcolor2 = When(
howdy < 2,’#ffff99′, howdy >= 2,’#58d68d’,
‘#f7dc6f’);
return {
//textColor:”,
backgroundColor:backcolor2,
topText: ‘Medical’,
topTextColor: ”,
topTextOutlineColor: ”,
topTextMaxSize: ‘medium’,
middleText: $datapoint[“Available”],
middleTextColor: ”,
middleTextOutlineColor: ”,
middleTextMaxSize: ‘large’,
bottomText: ‘Minimum of 2 responders required’,
bottomTextColor: ”,
bottomTextOutlineColor: ”,
bottomTextMaxSize: ‘small’,
//iconName:”,
//iconAlign:’left’,
//iconColor:”,
//iconOutlineColor:”,
//noValue:false,
//attributes: {
// attribute1: ”,
// attribute2: ”
// }
}